Here is a 15" oblate spheroid:
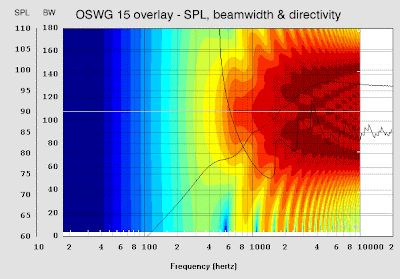
Now here is an overlay of SPL, beamwidth and the directivity plot. The scale on the x axis for the coloured directivity plot is close but not an exact match to the others.
You may notice that the beamwidth is quite jagged and that it narrows around 3 - 4k. The SPL plot shows that the sim isn't quite right. This is due to the incorrect parameters that I had to guess. However, I expect that the directivity would be dominated by the waveguide itself in this model rather than the driver, as long as
the throat area is correct.
the throat area is correct.
Now for comparison here are the plots of the oblate spheroid that we measured of a similar size:
This version is "normalised" so that the axial response is dead flat. What you see is more of an indication of it's dispersion relative to flat on axis.
The simulation doesn't look much like the measurements. The sims show narrow dispersion around 3 - 4k and elsewhere around 80 degrees. The measurements show narrow dispersion around 2 - 3k and considerable change throughout the range. The normalised plot shows that if EQ were used to make it flat on axis, the dispersion would vary so this makes for a difficult situation.


No comments:
Post a Comment
All comments are moderated.